Trend Consensus Engine [TCE]The Trend Consensus Engine (TCE) is a comprehensive market analysis system designed to filter out noise and provide a quantifiable "Trend Score" (0-100). Instead of relying on a single indicator, this script aggregates data from multiple market factors—volatility, momentum, and trend structure—to generate high-probability entry signals based on a consensus logic.
This tool is particularly optimized for Crypto (with specific time-gated logic) and BIST (Borsa Istanbul) markets, allowing traders to see the overall health of the trend at a glance via a dashboard.
How It Works
The engine calculates a composite "Total Score" (0-100) derived from four weighted components:
Trend Structure (AlphaTrend & Guppy):
Analyzes the slope and position relative to the AlphaTrend (Credit to @KivancOzbilgic) and Guppy Multiple Moving Averages (GMMA).
Positive slopes and price action above key levels add points to the score.
Volatility & Momentum (Squeeze & ADX):
Incorporates the Squeeze Momentum logic (Credit to @LazyBear) to detect explosive moves.
ADX Filter: Filters out chopping/ranging markets. If the ADX is too low, the score is penalized or the signal is blocked.
Dynamic Resistance (MA Channels):
Uses a combination of Donchian Mid-Lines and SMAs to determine if the price is in a "safe zone" or hitting resistance.
Price Action Filters (Pinbar Veto):
Automatically detects bearish "Shooting Star" or weak candles at highs. If a bearish pinbar is detected, the entry signal is vetoed regardless of the trend score.
Features & Settings
Smart Scoring Dashboard: Displays the realtime Score, Instant Decision, and confirmed Close Decision on the chart.
Market Profiles:
Crypto Mode: Includes a "Time Gate" feature (07:00 UTC+3 check) to prevent fakeouts during low-liquidity hours.
BIST Mode: Optimized parameters for the Turkish stock market logic (14:00 session checks).
Score Threshold: Users can adjust the minimum score required (Default: 70) to trigger a "BUY" signal.
Visual Guidance: The background of the dashboard changes color (Green/Red/Yellow) based on the consensus.
How to Use
Check the Dashboard: Look at the "SONUÇ" (Result) row.
GİRİŞ ✅ (ENTRY): The Score is above 70, Momentum is positive, and no Bearish Pinbars are present.
BEKLE ⏳ (WAIT): The trend is weak, or a filter (like ADX or Squeeze) is blocking the trade.
Confirm with Price Action: Use the AlphaTrend lines (Blue/Red) as dynamic support/stop-loss levels.
Credits:
AlphaTrend by KivancOzbilgic
Squeeze Momentum Indicator by LazyBear
VuManChu Cipher concepts for inspiration.
Custom Logic: Scoring algorithm and Time-Gating mechanisms are original custom developments.
Disclaimer: This tool is for educational purposes only and does not constitute financial advice.
Cari skrip untuk "key levels"

INSTITUTIONAL VOLUME PROFILE + FIBONACCI + ENHANCED SIGNALS🎯 INSTITUTIONAL VOLUME PROFILE + FIBONACCI + ENHANCED SIGNALS
A professional-grade indicator combining Volume Profile analysis, Fibonacci retracements, Anchored VWAP, and intelligent signal filtering to identify high-probability institutional positioning and trade setups.
📊 CORE FEATURES
▸ Volume Profile with POC (Point of Control)
- Visualizes where institutional volume accumulated
- Identifies High Volume Nodes (HVN) as key support/resistance
- Shows Value Area (70% volume zone) for market equilibrium
▸ Dynamic Fibonacci Levels
- Auto-detects swing high/low for retracement levels
- Golden Pocket (0.618-0.65) highlight zone
- Bull/bear direction recognition
▸ Anchored VWAP
- Anchored to swing range start
- Institutional mean reversion baseline
- Real-time trend bias indicator
▸ Graded Signal System (A+/B/C)
- A+ Signals: High probability setups (VWAP cross + POC alignment)
- B Signals: Above-average quality (VWAP cross above POC)
- C Signals: Lower probability (counter-trend setups)
🎮 DISPLAY MODES
⚡ TRADING LIVE MODE
- Clean chart showing only A+ signals
- Minimal visual noise for active trading
- Perfect for intraday execution
📈 FULL OVERVIEW MODE
- Complete analysis with all zones visible
- Volume Profile + Fibonacci + Value Area
- All signal grades displayed
- Statistics dashboard
🔬 ADVANCED SIGNAL FILTERS
✓ Volume Confirmation
- Requires above-average volume on signals
- Filters out weak institutional participation
- Configurable volume multiple (default 1.2x)
✓ Momentum Filter
- Ensures price momentum aligns with signal direction
- Prevents counter-trend entries
- Configurable lookback period
✓ SR Proximity Upgrade ⭐ GAME CHANGER
- Automatically upgrades B/C signals to A+ when near key levels
- Detects proximity to POC and HVN zones
- Combines technical confluence for best setups
🔔 SMART ALERTS
▸ Configurable alerts for A+, B, or C signals
▸ Real-time notifications to your device
▸ No need to watch charts constantly
▸ "Once per bar close" prevents repainting
💡 HOW TO USE
FOR DAY TRADING:
1. Switch to "Trading Live" mode
2. Enable only A+ alerts
3. Set filters: Volume 1.5x, Momentum ON, Proximity 0.3%
4. Trade only A+ signals at key levels
FOR SWING TRADING:
1. Use "Full Overview" mode
2. Analyze Value Area and Fibonacci confluence
3. Set filters: Volume 1.2x, Momentum ON, Proximity 0.8%
4. Enter on A+ signals with multi-timeframe confirmation
FOR ANALYSIS:
1. Full Overview mode with all visuals enabled
2. Disable filters to see all raw signals
3. Study how institutions positioned at key zones
4. Plan trades around POC and Value Area
⚙️ RECOMMENDED SETTINGS
5-15 MIN CHARTS (Scalping):
- Lookback: 200-300 bars
- Volume: 1.5x, Momentum: 5 bars, Proximity: 0.3%
- Trading Live mode + A+ alerts only
1 HOUR CHARTS (Intraday):
- Lookback: 300 bars
- Volume: 1.3x, Momentum: 3 bars, Proximity: 0.5%
- Full Overview or Trading Live
4 HOUR CHARTS (Swing):
- Lookback: 300-500 bars
- Volume: 1.2x, Momentum: 3 bars, Proximity: 0.8%
- Full Overview mode
DAILY CHARTS (Position):
- Lookback: 300-500 bars
- Volume: 1.1x, Momentum: 2 bars, Proximity: 1.0%
- Full Overview mode
📈 KEY CONCEPTS
POC (Point of Control): Price level with highest volume - acts as magnet
Value Area: Zone containing 70% of volume - equilibrium range
HVN: High Volume Nodes - institutional accumulation zones
AVWAP: Anchored VWAP - institutional average entry price
Golden Pocket: 0.618-0.65 Fib zone - highest probability reversal area
🎯 TRADING STRATEGY TIPS
1. Wait for A+ signals - quality over quantity
2. Best setups occur at POC or Value Area boundaries
3. Use multiple timeframes for confirmation
4. Combine with your own risk management rules
5. Signals are high probability, not guaranteed - always use stops

Market Structure Shift (MSS) [Sword & Shield]MARKET STRUCTURE SHIFT (MSS)
A clean and focused indicator for identifying Market Structure Shifts in price action.
════════════════════════════════════════════════════════════════════════════════
WHAT IS MARKET STRUCTURE SHIFT (MSS)?
════════════════════════════════════════════════════════════════════════════════
A Market Structure Shift occurs when price breaks a significant swing high or swing low,
indicating a potential change in market direction. This indicator automatically detects
and plots these key levels.
BULLISH MSS: Price breaks above a previous swing high
BEARISH MSS: Price breaks below a previous swing low
════════════════════════════════════════════════════════════════════════════════
FEATURES
════════════════════════════════════════════════════════════════════════════════
CLEAN DISPLAY
- Shows only the last 2 MSS by default (1 bullish + 1 bearish)
- Keeps charts clean and focused on recent structure
- Automatically removes old MSS when new ones appear
CUSTOMIZABLE DETECTION
- Adjustable swing detection (left/right bars)
- Choose break confirmation method (Close or Wick)
- Fixed-length lines (no infinite extension by default)
SMART FILTERING
- Only plots one MSS per direction until opposite MSS occurs
- Prevents duplicate signals in the same direction
- Clear visual distinction between bullish (blue) and bearish (red)
CLEAN LABELS
- Text labels positioned above lines
- No background tooltips for cleaner appearance
- Color-matched to their respective MSS lines
════════════════════════════════════════════════════════════════════════════════
SETTINGS
════════════════════════════════════════════════════════════════════════════════
SWING DETECTION
- Swing Left Bars (default: 2)
- Swing Right Bars (default: 2)
- Higher values = more significant swings detected
BREAK CONFIRMATION
- Close: MSS confirmed when candle closes beyond level
- Wick: MSS confirmed when wick touches beyond level
DISPLAY OPTIONS
- Show Only Last 2 MSS: ON by default (keeps chart clean)
- Extend lines to the right: OFF by default (fixed-length lines)
- Line bars (when not extended): 50 bars (customizable)
════════════════════════════════════════════════════════════════════════════════
HOW IT WORKS
════════════════════════════════════════════════════════════════════════════════
DETECTION LOGIC
1. Identifies swing highs and swing lows using pivot detection
2. Monitors price action for breaks of these levels
3. Confirms break based on selected method (Close or Wick)
4. Plots MSS line at the broken level
FILTERING LOGIC
- Only one MSS per direction is allowed consecutively
- Example: If bullish MSS appears, no new bullish MSS until bearish MSS occurs
- This prevents multiple signals in trending markets
DISPLAY LOGIC
- When "Show Only Last 2 MSS" is enabled:
• Only the most recent bullish MSS is shown
• Only the most recent bearish MSS is shown
• Old MSS are automatically deleted when new ones appear
- When disabled: All historical MSS remain visible
════════════════════════════════════════════════════════════════════════════════
USAGE EXAMPLES
════════════════════════════════════════════════════════════════════════════════
FOR TREND IDENTIFICATION
- Bullish MSS = Potential uptrend beginning
- Bearish MSS = Potential downtrend beginning
- Use in conjunction with other indicators for confirmation
FOR ENTRY SIGNALS
- Wait for MSS to confirm trend change
- Enter on pullback to MSS level
- Use MSS as support/resistance
FOR SCALPING (Lower Timeframes)
- Swing Left/Right Bars: 2-3 (more sensitive)
- Break Confirmation: Close (more reliable)
- Show Only Last 2 MSS: ON (cleaner charts)
FOR SWING TRADING (Higher Timeframes)
- Swing Left/Right Bars: 5-10 (more significant swings)
- Break Confirmation: Close (avoid false breaks)
- Show Only Last 2 MSS: ON or OFF based on preference
════════════════════════════════════════════════════════════════════════════════
VISUAL DESIGN
════════════════════════════════════════════════════════════════════════════════
LINES
- Dashed style for easy identification
- Blue for bullish MSS
- Red for bearish MSS
- Fixed length (50 bars default) for cleaner appearance
LABELS
- "MSS" text positioned above each line
- No background for clean display
- Color-matched to line color
- Small size to avoid chart clutter
════════════════════════════════════════════════════════════════════════════════
CREDITS & LICENSE
════════════════════════════════════════════════════════════════════════════════
© Sword & Shield
This Pine Script code is subject to the terms of the Mozilla Public License 2.0
mozilla.org

alertable spaceman v2slight modification to Key Levels SpacemanBTC IDWM script
credit: spacemanbtc
this is a new version to fix a bug that would pop unwanted alerts on certain levels. I realised the issue was how tradingview handles time. in tradingview,1D paints a new candle at 7pm NY time, but in low timeframe, the "next" day doesn't officially start until 12a.m, like a military clock would. this would cause some repainting issues.
implemented some changes by using stable values that would hopefully circumvent that. script is open sourced in case anyone wants to use it to make changes in case there are other issues

Float Rotation TrackerFloat Rotation Tracker - Quick Reference Guide
What is Float Rotation?
Float Rotation = Cumulative Daily Volume ÷ Float
Example:
Float = 5,000,000 shares
Day Volume = 7,500,000 shares
Rotation = 7.5M ÷ 5M = 1.5x (150%)
When rotation hits 1x (100%), every available share has theoretically changed hands at least once during the trading day.
Why It Matters
RotationMeaningImplication0.5x50% of float tradedInterest building1.0x 🔥Full rotationExtreme interest confirmed2.0x 🔥🔥Double rotationVery high volatility3.0x 🔥🔥🔥Triple rotationRare - maximum volatility
Key insight: High rotation on a low-float stock = explosive potential
Float Classification
Float SizeClassificationRotation Impact≤ 2M🔥 MICROExtremely volatile, fast rotation≤ 5M🔥 VERY LOWExcellent momentum potential≤ 10MLOWGood for rotation plays> 10MNORMALNeeds massive volume to rotate
Rule of thumb: Focus on stocks with float under 10M for meaningful rotation signals.
Reading the Indicator
Rotation Line (Yellow)
Shows current rotation level
Rises throughout the day as volume accumulates
Crosses horizontal level lines at milestones
Level Lines
LineColorMeaning0.5Gray dotted50% rotation1.0Orange solidFull rotation2.0Red solidDouble rotation3.0Fuchsia solidTriple rotation
Volume Bars (Bottom)
ColorMeaningGrayBelow average volumeBlueNormal volume (1-2x avg)GreenHigh volume (2-5x avg)LimeExtreme volume (5x+ avg)
Milestone Markers
Circles appear when rotation crosses key levels
Labels show "50%", "1x", "2x", "3x🔥"
Background Color
Changes as rotation increases
Darker = higher rotation level
Info Table Explained
FieldDescriptionFloatShare count + classification (MICRO/LOW/NORMAL)SourceAuto ✓ = TradingView data / Manual = user enteredRotationCurrent rotation with emoji indicatorRotation %Same as rotation × 100Day VolumeCumulative volume todayTo XxVolume needed to reach next milestoneBar RVolCurrent bar's relative volumeMilestonesWhich levels have been hit todayPer RotationShares equal to one full rotationEst. TimeBars until next milestone (at current pace)
Trading with Float Rotation
Entry Signals
Early Entry (Higher Risk, Higher Reward)
Rotation approaching 0.5x
Strong price action (bull flag, breakout)
Rising relative volume bars
Confirmation Entry (Lower Risk)
Rotation at or above 1x
Price holding above VWAP
Continuous green/lime volume bars
Late Entry (Highest Risk)
Rotation above 2x
Only enter on clear pullback pattern
Tight stop required
Exit Signals
Warning Signs:
Rotation very high (2x+) with declining volume bars
Reversal candle after milestone
Price breaking below key support
Volume bars turning gray/blue after being green/lime
Take Profits:
Partial profit at each rotation milestone
Trail stop as rotation increases
Full exit on reversal pattern after 2x+ rotation
Best Setups
Ideal Float Rotation Play
✓ Float under 10M (preferably under 5M)
✓ Stock up 5%+ on the day
✓ News catalyst driving interest
✓ Rotation approaching or exceeding 1x
✓ Price above VWAP
✓ Volume bars green or lime
✓ Clear chart pattern (bull flag, flat top)
Red Flags to Avoid
✗ Float over 50M (hard to rotate meaningfully)
✗ Rotation high but price declining
✗ Volume bars turning gray after spike
✗ No clear catalyst
✗ Price below VWAP with high rotation
✗ Late in day (3pm+) after 2x rotation
Float Data Sources
If auto-detect doesn't work, get float from:
SourceHow to FindFinvizfinviz.com → ticker → "Shs Float"Yahoo FinanceFinance.yahoo.com → Statistics → "Float"MarketWatchMarketwatch.com → ticker → ProfileYour BrokerUsually in stock details/fundamentals
Note: Float can change due to offerings, buybacks, lockup expirations. Check recent data.
Settings Guide
Conservative Settings
Alert Level 1: 0.75 (75%)
Alert Level 2: 1.0 (100%)
Alert Level 3: 2.0 (200%)
Alert Level 4: 3.0 (300%)
High Vol Multiplier: 2.0
Extreme Vol Multiplier: 5.0
Aggressive Settings
Alert Level 1: 0.3 (30%)
Alert Level 2: 0.5 (50%)
Alert Level 3: 1.0 (100%)
Alert Level 4: 2.0 (200%)
High Vol Multiplier: 1.5
Extreme Vol Multiplier: 3.0
Alert Setup
Recommended Alerts
100% Rotation (1x) - Primary signal
Most important milestone
Confirms extreme interest
High Rotation + Extreme Volume
Combined condition
Very high probability signal
How to Set
Right-click chart → Add Alert
Condition: Float Rotation Tracker
Select desired milestone
Set notification (popup/email/phone)
Set expiration
Common Questions
Q: Why is my float showing "Manual (no data)"?
A: TradingView doesn't have float data for this stock. Enter the float manually in settings after looking it up on Finviz or Yahoo Finance.
Q: The rotation seems too high/low - is the float wrong?
A: Possibly. Cross-check float on Finviz. Recent offerings or share structure changes may not be reflected in TradingView's data.
Q: What if float rotates early in the day?
A: Early 1x rotation (within first hour) is very bullish - indicates massive interest. Watch for continuation patterns.
Q: High rotation but price is dropping?
A: This is distribution - large holders are selling into demand. High rotation doesn't guarantee price direction, just volatility.
Q: Can I use this for swing trading?
A: The indicator resets daily, so it's designed for intraday use. You could note multi-day rotation patterns manually.
Quick Decision Matrix
RotationPrice ActionVolumeDecision<0.5xStrong upHighWatch, early stage0.5-1xConsolidatingSteadyPrepare entry1x+Breaking outIncreasingEntry on pattern1x+DroppingHighAvoid - distribution2x+Strong upExtremePartial profit, trail stop2x+Reversal candleDecliningExit or avoid
Workflow Integration
MORNING ROUTINE:
1. Scan for gappers (5%+, high volume)
2. Check float on each candidate
3. Apply Float Rotation Tracker
4. Prioritize lowest float with building rotation
DURING SESSION:
5. Watch rotation levels on active trades
6. Enter on patterns when rotation confirms (0.5-1x)
7. Scale out as rotation increases
8. Exit or trail after 2x rotation
END OF DAY:
9. Note which stocks hit 2x+ rotation
10. Review rotation vs price action
11. Learn patterns for future trades
Combining with Other Indicators
IndicatorHow to Use Together5 PillarsScreen for low-float stocks firstGap & GoCheck rotation on gappersBull FlagEnter bull flags with 1x+ rotationVWAPOnly trade rotation plays above VWAPRSIWatch for divergence at high rotation
Key Takeaways
Float size matters - Lower float = faster rotation = more volatility
1x is the key level - Full rotation confirms extreme interest
Volume quality matters - Green/lime bars better than gray
Combine with price action - Rotation confirms, patterns trigger
Know when you're late - 2x+ rotation is late stage
Check your float data - Wrong float = wrong rotation calculation
Happy Trading! 🔥

Power RSI Segment Runner [CHE] Power RSI Segment Runner — Tracks RSI momentum across higher timeframe segments to detect directional switches for trend confirmation.
Summary
This indicator calculates a running Relative Strength Index adapted to segments defined by changes in a higher timeframe, such as daily closes, providing a smoothed view of momentum within each period. It distinguishes between completed segments, which fix the final RSI value, and ongoing ones, which update in real time with an exponential moving average filter. Directional switches between bullish and bearish momentum trigger visual alerts, including overlay lines and emojis, while a compact table displays current trend strength as a progress bar. This segmented approach reduces noise from intra-period fluctuations, offering clearer signals for trend persistence compared to standard RSI on lower timeframes.
Motivation: Why this design?
Standard RSI often generates erratic signals in choppy markets due to constant recalculation over fixed lookback periods, leading to false reversals that mislead traders during range-bound or volatile phases. By resetting the RSI accumulation at higher timeframe boundaries, this indicator aligns momentum assessment with broader market cycles, capturing sustained directional bias more reliably. It addresses the gap between short-term noise and long-term trends, helping users filter entries without over-relying on absolute overbought or oversold thresholds.
What’s different vs. standard approaches?
- Baseline Reference: Diverges from the classic Wilder RSI, which uses a fixed-length exponential moving average of gains and losses across all bars.
- Architecture Differences:
- Segments momentum resets at higher timeframe changes, isolating calculations per period instead of continuous history.
- Employs persistent sums for ups and downs within segments, with on-the-fly RSI derivation and EMA smoothing.
- Integrates switch detection logic that clears prior visuals on reversal, preventing clutter from outdated alerts.
- Adds overlay projections like horizontal price lines and dynamic percent change trackers for immediate trade context.
- Practical Effect: Charts show discrete RSI endpoints for past segments alongside a curved running trace, making momentum evolution visually intuitive. Switches appear as clean, extendable overlays, reducing alert fatigue and highlighting only confirmed directional shifts, which aids in avoiding whipsaws during minor pullbacks.
How it works (technical)
The indicator begins by detecting changes in the specified higher timeframe, such as a new daily bar, to define segment boundaries. At each boundary, it finalizes the prior segment's RSI by summing positive and negative price changes over that period and derives the value from the ratio of those sums, then applies an exponential moving average for smoothing. Within the active segment, it accumulates ongoing ups and downs from price changes relative to the source, recalculating the running RSI similarly and smoothing it with the same EMA length.
Points for the running RSI are collected into an array starting from the segment's onset, forming a curved polyline once sufficient bars accumulate. Comparisons between the running RSI and the last completed segment's value determine the current direction as long, short, or neutral, with switches triggering deletions of old visuals and creation of new ones: a label at the RSI pane, a vertical dashed line across the RSI range, an emoji positioned via ATR offset on the price chart, a solid horizontal line at the switch price, a dashed line tracking current close, and a midpoint label for percent change from the switch.
Initialization occurs on the first bar by resetting accumulators, and visualization gates behind a minimum bar count since the segment start to avoid early instability. The trend strength table builds vertically with filled cells proportional to the rounded RSI value, colored by direction. All drawing objects update or extend on subsequent bars to reflect live progress.
Parameter Guide
EMA Length — Controls the smoothing applied to the running RSI; higher values increase lag but reduce noise. Default: 10. Trade-offs: Shorter settings heighten sensitivity for fast markets but risk more false switches; longer ones suit trending conditions for stability.
Source — Selects the price data for change calculations, typically close for standard momentum. Default: close. Trade-offs: Open or high/low may emphasize gaps, altering segment intensity.
Segment Timeframe — Defines the higher timeframe for segment resets, like daily for intraday charts. Default: D. Trade-offs: Shorter frames create more frequent but shorter segments; longer ones align with major cycles but delay resets.
Overbought Level — Sets the upper threshold for potential overbought conditions (currently unused in visuals). Default: 70. Trade-offs: Adjust for asset volatility; higher values delay bearish warnings.
Oversold Level — Sets the lower threshold for potential oversold conditions (currently unused in visuals). Default: 30. Trade-offs: Lower values permit deeper dips before signaling bullish potential.
Show Completed Label — Toggles labels at segment ends displaying final RSI. Default: true. Trade-offs: Enables historical review but can crowd charts on dense timeframes.
Plot Running Segment — Enables the curved polyline for live RSI trace. Default: true. Trade-offs: Visualizes intra-segment flow; disable for cleaner panes.
Running RSI as Label — Displays current running RSI as a forward-projected label on the last bar. Default: false. Trade-offs: Useful for quick reads; may overlap in tight scales.
Show Switch Label — Activates RSI pane labels on directional switches. Default: true. Trade-offs: Provides context; omit to minimize pane clutter.
Show Switch Line (RSI) — Draws vertical dashed lines across the RSI range at switches. Default: true. Trade-offs: Marks reversal bars clearly; extends both ways for reference.
Show Solid Overlay Line — Projects a horizontal line from switch price forward. Default: true. Trade-offs: Acts as dynamic support/resistance; wider lines enhance visibility.
Show Dashed Overlay Line — Tracks a dashed line from switch to current close. Default: true. Trade-offs: Shows price deviation; thinner for subtlety.
Show Percent Change Label — Midpoint label tracking percent move from switch. Default: true. Trade-offs: Quantifies progress; centers dynamically.
Show Trend Strength Table — Displays right-side table with direction header and RSI bar. Default: true. Trade-offs: Instant strength gauge; fixed position avoids overlap.
Activate Visualization After N Bars — Delays signals until this many bars into a segment. Default: 3. Trade-offs: Filters immature readings; higher values miss early momentum.
Segment End Label — Color for completed RSI labels. Default: 7E57C2. Trade-offs: Purple tones for finality.
Running RSI — Color for polyline and running elements. Default: yellow. Trade-offs: Bright for live tracking.
Long — Color for bullish switch visuals. Default: green. Trade-offs: Standard for uptrends.
Short — Color for bearish switch visuals. Default: red. Trade-offs: Standard for downtrends.
Solid Line Width — Thickness of horizontal overlay line. Default: 2. Trade-offs: Bolder for emphasis on key levels.
Dashed Line Width — Thickness of tracking and vertical lines. Default: 1. Trade-offs: Finer to avoid dominance.
Reading & Interpretation
Completed segment RSIs appear as static points or labels in purple, indicating the fixed momentum at period close—values drifting toward the upper half suggest building strength, while lower half implies weakness. The yellow curved polyline traces the live smoothed RSI within the current segment, rising for accumulating gains and falling for losses. Directional labels and lines in green or red flag switches: green for running momentum exceeding the prior segment's, signaling potential uptrend continuation; red for the opposite.
The right table's header colors green for long, red for short, or gray for neutral/wait, with filled purple bars scaling from bottom (low RSI) to top (high), topped by the numeric value. Overlay elements project from switch bars: the solid green/red line as a price anchor, dashed tracker showing pullback extent, and percent label quantifying deviation—positive for alignment with direction, negative for counter-moves. Emojis (up arrow for long, down for short) float above/below price via ATR spacing for quick chart scans.
Practical Workflows & Combinations
- Trend Following: Enter long on green switch confirmation after a higher high in structure; filter with table strength above midpoint for conviction. Pair with volume surge for added weight.
- Exits/Stops: Trail stops to the solid overlay line on pullbacks; exit if percent change reverses beyond 2 percent against direction. Use wait bars to confirm without chasing.
- Multi-Asset/Multi-TF: Defaults suit forex/stocks on 1H-4H with daily segments; for crypto, shorten EMA to 5 for volatility. Scale segment TF to weekly for daily charts across indices.
- Combinations: Overlay on EMA clouds for confluence—switch aligning with cloud break strengthens signal. Add volatility filters like ATR bands to debounce in low-volume regimes.
Behavior, Constraints & Performance
Signals confirm on bar close within segments, with running polyline updating live but gated by minimum bars to prevent flicker. Higher timeframe changes may introduce minor repaints on timeframe switches, mitigated by relying on confirmed HTF closes rather than intrabar peeks. Resource limits cap at 500 labels/lines and 50 polylines, pruning old objects on switches to stay efficient; no explicit loops, but array growth ties to segment length—suitable for up to 500-bar histories without lag.
Known limits include delayed visualization in short segments and insensitivity to overbought/oversold levels, as thresholds are inputted but not actively visualized. Gaps in source data reset accumulators prematurely, potentially skewing early RSI.
Sensible Defaults & Quick Tuning
Start with EMA length 10, daily segments, and 3-bar wait for balanced responsiveness on hourly charts. For excessive switches in ranging markets, increase wait bars to 5 or EMA to 14 to dampen noise. If signals lag in trends, drop EMA to 5 and use 1H segments. For stable assets like indices, widen to weekly segments; tune colors for dark/light themes without altering logic.
What this indicator is—and isn’t
This tool serves as a momentum visualization and switch detector layered over price action, aiding trend identification and confirmation in segmented contexts. It is not a standalone trading system, predictive model, or risk calculator—always integrate with broader analysis, position sizing, and stop-loss discipline. View it as an enhancement for discretionary setups, not automated alerts without validation.
Disclaimer
The content provided, including all code and materials, is strictly for educational and informational purposes only. It is not intended as, and should not be interpreted as, financial advice, a recommendation to buy or sell any financial instrument, or an offer of any financial product or service. All strategies, tools, and examples discussed are provided for illustrative purposes to demonstrate coding techniques and the functionality of Pine Script within a trading context.
Any results from strategies or tools provided are hypothetical, and past performance is not indicative of future results. Trading and investing involve high risk, including the potential loss of principal, and may not be suitable for all individuals. Before making any trading decisions, please consult with a qualified financial professional to understand the risks involved.
By using this script, you acknowledge and agree that any trading decisions are made solely at your discretion and risk.
Do not use this indicator on Heikin-Ashi, Renko, Kagi, Point-and-Figure, or Range charts, as these chart types can produce unrealistic results for signal markers and alerts.
Best regards and happy trading
Chervolino

Cross3x v2Cross3x – Smart Trend & Rejection Detection System
Cross3x is a precision trading indicator designed for traders who combine trend-following with early reversal detection. Built on a triple moving average core, it delivers high-quality signals with minimal noise and maximum clarity.
Core Features:
Trend Filtered Crossover: Uses a fast EMA (18), slow EMA (33), and long-term SMA (99) to generate reliable entry signals only in the direction of the dominant trend.
Dynamic SL/TP/BE Management:
Stop Loss placed at the lowest/highest extreme over a user-defined lookback.
Take Profit calculated using a customizable Risk/Reward ratio.
Break-Even level set as a percentage between entry and TP (e.g., 10% = BE just above entry).
Early Rejection Signals: Flags potential reversals when price tests a moving average with a long wick during a countertrend candle — ideal for spotting pullbacks before the next leg.
Green flag: "Potential Long Setup" after a bullish rejection.
Red flag: "Potential Short Setup" after a bearish rejection.
Confirmation Points: Circles appear when price retraces cleanly after a crossover, signaling optimal entry zones.
Interactive Dashboard: Real-time table showing current signal, SL, and TP levels.
Customizable Alerts: Fully configurable alerts for entries, confirmation points, and rejection setups.
Why Use Cross3x?
It doesn’t just follow trends — it anticipates them. By combining classical crossovers with smart rejection logic and structured risk management, Cross3x helps you enter earlier, manage risk better, and stay aligned with market momentum.
Perfect for swing traders, intraday scalpers, and algorithmic strategies seeking a clean, robust foundation.
Usage Tips:
Combine "Potential" flags with order blocks or key levels for higher accuracy.
Use confirmation circles as entry triggers after early setups.
Adjust RR and BE% based on volatility and trading style.
Deploy Cross3x to turn simple crossovers into a complete trading methodology.
STRIKE BOXThis **“STRIKE BOX”** Pine Script is used by traders to visually define and track the **New York Opening Range (OR)** — one of the most important time windows in intraday trading — and to monitor how price behaves relative to that range throughout the rest of the session.
Here’s the breakdown of what it’s used for and why traders care:
---
### 🕘 **Purpose**
The script automatically identifies and plots:
1. **The New York Opening Range (8:00–9:30 AM NY time)** – where institutional volume begins to surge.
2. **The Trading Session (9:30–17:00 NY time)** – the official U.S. stock market hours.
It marks the **high and low of the opening range** and then watches for **breakouts** or **retests** during the rest of the day.
---
### 💡 **Why traders use this**
1. **Identify key liquidity zones**
* The high and low of the opening range often represent **areas of trapped traders**, **liquidity pools**, and **institutional positioning**.
* Price tends to **revisit or react strongly** around these levels.
2. **Find breakout or reversal opportunities**
* Traders wait for price to **break above or below** the OR to confirm **directional bias** for the day.
* For example:
* A break above the OR high = possible bullish continuation.
* A break below the OR low = possible bearish momentum.
* If price fails to break and stays inside the range, that signals a **choppy or consolidating market**.
3. **Define risk and targets easily**
* The OR gives **natural stop-loss and take-profit zones**.
* A trader can buy near the OR low and target the OR high, or vice versa.
4. **Filter trades during high-volume hours**
* The New York session overlaps with London for a bit — this is when **most daily volume and volatility** occur.
* Many traders only want to trade inside or just after this opening period.
---
### 📊 **How this script helps**
* It **automatically draws lines** for the OR high and low.
* It plots **vertical dashed lines** marking when the OR starts and ends.
* It **detects when price breaks the OR** (sets `High_Break` or `Low_Break` to true).
* It provides clear **visual zones** for decision-making instead of manually drawing them every day.
---
### 🧠 In short
Traders use this to:
* See where the **New York Opening Range** formed.
* Watch for **breakouts or fakeouts** beyond that range.
* Align their trades with **institutional market flow**.
* Keep charts **clean and systematic** rather than guessing daily key levels.
---

Opening Range IndicatorComplete Trading Guide: Opening Range Breakout Strategy
What Are Opening Ranges?
Opening ranges capture the high and low prices during the first few minutes of market open. These levels often act as key support and resistance throughout the trading day because:
Heavy volume occurs at market open as overnight orders execute
Institutional activity is concentrated during opening minutes
Price discovery happens as market participants react to overnight news
Psychological levels are established that traders watch all day
Understanding the Three Timeframes
OR5 (5-Minute Range: 9:30-9:35 AM)
Most sensitive - captures immediate market reaction
Quick signals but higher false breakout rate
Best for scalping and momentum trading
Use for early entry when conviction is high
OR15 (15-Minute Range: 9:30-9:45 AM)
Balanced approach - most popular among day traders
Moderate sensitivity with better reliability
Good for swing trades lasting several hours
Primary timeframe for most strategies
OR30 (30-Minute Range: 9:30-10:00 AM)
Most reliable but slower signals
Lower false breakout rate
Best for position trades and trend following
Use when looking for major moves
Core Trading Strategies
Strategy 1: Basic Breakout
Setup:
Wait for price to break above OR15 high or below OR15 low
Enter on the breakout candle close
Stop loss: Opposite side of the range
Target: 2-3x the range size
Example:
OR15 range: $100.00 - $102.00 (Range = $2.00)
Long entry: Break above $102.00
Stop loss: $99.50 (below OR15 low)
Target: $104.00+ (2x range size)
Strategy 2: Multiple Confirmation
Setup:
Wait for OR5 break first (early signal)
Confirm with OR15 break in same direction
Enter on OR15 confirmation
Stop: Below OR30 if available, or OR15 opposite level
Why it works:
Multiple timeframe confirmation reduces false signals and increases probability of sustained moves.
Strategy 3: Failed Breakout Reversal
Setup:
Price breaks OR15 level but fails to hold
Wait for re-entry into the range
Enter reversal trade toward opposite OR level
Stop: Recent breakout high/low
Target: Opposite side of range + extension
Key insight: Failed breakouts often lead to strong moves in the opposite direction.
Advanced Techniques
Range Quality Assessment
High-Quality Ranges (Trade these):
Range size: 0.5% - 2% of stock price
Clean boundaries (not choppy)
Volume spike during range formation
Clear rejection at range levels
Low-Quality Ranges (Avoid these):
Very narrow ranges (<0.3% of stock price)
Extremely wide ranges (>3% of stock price)
Choppy, overlapping candles
Low volume during formation
Volume Confirmation
For Breakouts:
Look for volume spike (2x+ average) on breakout
Declining volume often signals false breakout
Rising volume during range formation shows interest
Market Context Filters
Best Conditions:
Trending market days (SPY/QQQ with clear direction)
Earnings reactions or news-driven moves
High-volume stocks with good liquidity
Volatility above average (VIX considerations)
Avoid Trading When:
Extremely low volume days
Major economic announcements pending
Holidays or half-days
Choppy, sideways market conditions
Risk Management Rules
Position Sizing
Conservative: Risk 0.5% of account per trade
Moderate: Risk 1% of account per trade
Aggressive: Risk 2% maximum per trade
Stop Loss Placement
Inside the range: Quick exit but higher stop-out rate
Outside opposite level: More room but larger risk
ATR-based: 1.5-2x Average True Range below entry
Profit Taking
Target 1: 1x range size (take 50% off)
Target 2: 2x range size (take 25% off)
Runner: Trail remaining 25% with moving stops
Specific Entry Techniques
Breakout Entry Methods
Method 1: Immediate Entry
Enter as soon as price closes above/below range
Fastest entry but highest false signal rate
Best for strong momentum situations
Method 2: Pullback Entry
Wait for breakout, then pullback to range level
Enter when price bounces off former resistance/support
Better risk/reward but may miss some moves
Method 3: Volume Confirmation
Wait for breakout + volume spike
Enter after volume confirmation candle
Reduces false signals significantly
Multiple Timeframe Entries
Aggressive: OR5 break → immediate entry
Conservative: OR5 + OR15 + OR30 all align → enter
Balanced: OR15 break with OR30 support → enter
Common Mistakes to Avoid
1. Trading Poor-Quality Ranges
❌ Don't trade ranges that are too narrow or too wide
✅ Focus on clean, well-defined ranges with good volume
2. Ignoring Volume
❌ Don't chase breakouts without volume confirmation
✅ Always check for volume spike on breakouts
3. Over-Trading
❌ Don't force trades when ranges are unclear
✅ Wait for high-probability setups only
4. Poor Risk Management
❌ Don't risk more than planned or use tight stops in volatile conditions
✅ Stick to predetermined risk levels
5. Fighting the Trend
❌ Don't fade breakouts in strongly trending markets
✅ Align trades with overall market direction
Daily Trading Routine
Pre-Market (8:00-9:30 AM)
Check overnight news and earnings
Review major indices (SPY, QQQ, IWM)
Identify potential opening range candidates
Set alerts for range breakouts
Market Open (9:30-10:00 AM)
Watch opening range formation
Note volume and price action quality
Mark key levels on charts
Prepare for breakout signals
Trading Session (10:00 AM - 4:00 PM)
Execute breakout strategies
Manage existing positions
Trail stops as profits develop
Look for additional setups
Post-Market Review
Analyze winning and losing trades
Review range quality vs. outcomes
Identify improvement areas
Prepare for next session
Best Stocks/ETFs for Opening Range Trading
Large Cap Stocks (Best for beginners):
AAPL, MSFT, GOOGL, AMZN, TSLA
High liquidity, predictable behavior
Good range formation most days
ETFs (Consistent patterns):
SPY, QQQ, IWM, XLF, XLE
Excellent liquidity
Clear range boundaries
Mid-Cap Growth (Advanced traders):
Stocks with good volume (1M+ shares daily)
Recent news catalysts
Clean technical patterns
Performance Optimization
Track These Metrics:
Win rate by range type (OR5 vs OR15 vs OR30)
Average R/R (risk vs reward ratio)
Best performing market conditions
Time of day performance
Continuous Improvement:
Keep detailed trade journal
Review failed breakouts for patterns
Adjust position sizing based on win rate
Refine entry timing based on backtesting
Final Tips for Success
Start small - Paper trade or use tiny positions initially
Focus on quality - Better to miss trades than take bad ones
Stay disciplined - Stick to your rules even during losing streaks
Adapt to conditions - What works in trending markets may fail in choppy conditions
Keep learning - Markets evolve, so should your approach
The opening range strategy is powerful because it captures natural market behavior, but like all strategies, it requires practice, discipline, and proper risk management to be profitable long-term.

OSOK KatxumotoThe OSOK Dynamic Box Enhanced is designed for scalpers and traders using the OSOK (One Shot, One Kill) method on futures like the NQ.
Features include:
A midline that dynamically follows the current price in real-time.
Upper (LS) and lower (LI) protection lines at configurable distances from the current price, representing stop or protection levels.
Target lines offset from LS and LI according to your risk/reward strategy, also fully configurable.
Customizable colors and thickness for all lines, allowing you to adapt the visualization to your trading style.
All lines automatically extend to the right from the current price, keeping the chart clean without accumulating old lines.
This indicator helps traders quickly visualize key levels, manage risk, and set objectives efficiently—perfect for scalping and high-precision setups.
Configurable parameters:
Protection distance (LS/LI) in points
Target distance from LS/LI in points
Line colors and thickness
Line extension to the right

Statistical FootprintStatistical Footprint - Behavioral Support & Resistance
This indicator identifies key price levels based on actual market behavior rather than traditional pivot calculations. It analyzes how bulls and bears have historically moved price from session opens, creating statistical zones where future reactions are most likely.
The concept is simple: track how far bullish candles typically push above the open versus how far bearish candles drop below it. These patterns reveal the market's behavioral "footprint" - showing where momentum typically stalls and reverses.
Key Features:
- Separate analysis for daily and weekly timeframes
- Smart zone merging when levels cluster together (within 5 points)
- Uses both mean and median calculations for more robust levels
- XGBoost-optimized lookback periods for maximum statistical significance
- Clean zone-only display focused on actionable price areas
How it Works:
The code separates bullish and bearish sessions, measuring their typical range extensions from the open. It then projects these statistical ranges forward from current session opens, creating "behavioral zones" where the market has historically shown consistent reactions.
When daily and weekly levels align closely, they merge into combined zones with enhanced significance. Labels show both the mean and median values when they differ meaningfully.
Best Used For:
- Identifying high-probability reversal zones
- Setting profit targets based on historical behavior
- Understanding market sentiment shifts at key levels
- Confluence analysis between different timeframes
The lookback periods have been optimized using machine learning to find the most predictive historical sample sizes for current market conditions.
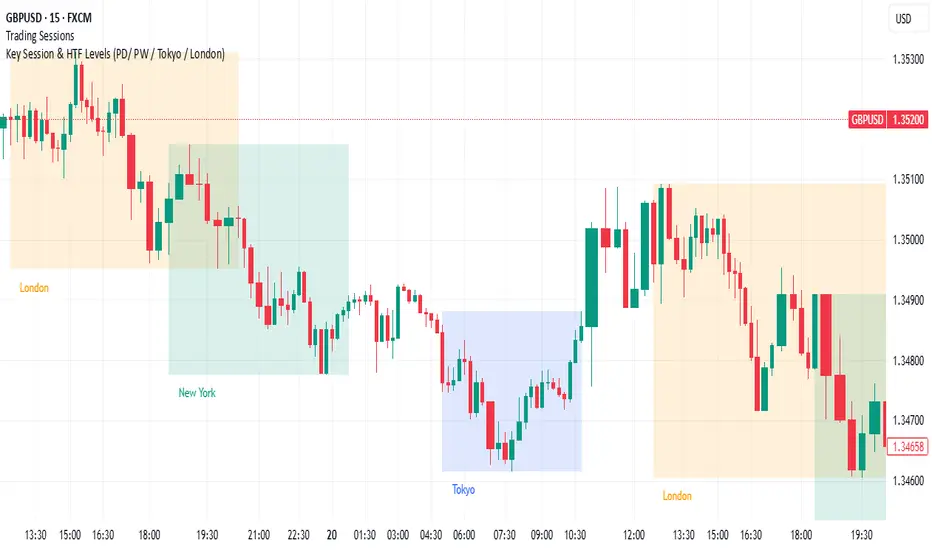
Key Session & LevelsThis indicator helps traders track key price levels for multiple timeframes and trading sessions. It plots:
Previous Day's High and Low (PD): Highlighting the high and low of the previous trading day.
Previous Week's High and Low (PW): Plotting the highest and lowest price levels for the past week.
Tokyo Session High and Low (Today): Displays the high and low levels for the Tokyo trading session (adjustable to your preferred time window).
London Session High and Low (Today): Tracks the high and low for the London trading session (also adjustable for your timezone and desired session window).
Features:
Customizable Time Zones: The indicator uses your preferred timezone to calculate session highs/lows.
Extendable Lines: Lines for each level extend to the right of the chart, providing continuous reference throughout the trading day.
Adjustable Settings: Fine-tune the visibility and width of the lines, and choose which levels to display (Previous Day, Previous Week, Tokyo, and London sessions).
Non-Repainting: This script uses historical data and only updates when new bars are confirmed, ensuring accurate and reliable signals.
Whether you're a day trader, swing trader, or just tracking key levels for strategic entries and exits, this tool provides quick visual reference to important price points across different trading sessions.
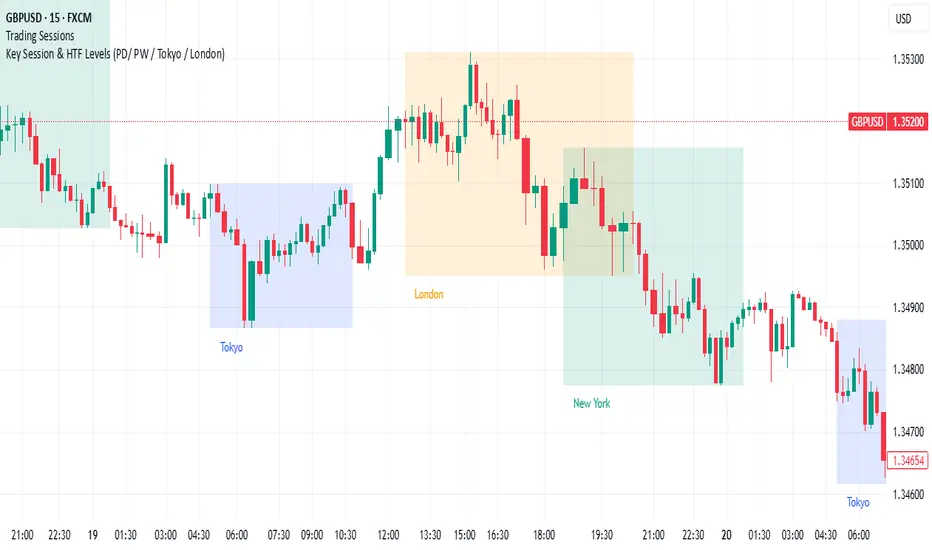
TrueOpens [AY]¹ See how price reacts to key multi-day and monthly open levels—perfect for S/R-focused traders.
Experimental indicator for tracking multi-day openings and ICT True Month Open levels, ideal for S/R traders.
TrueOpens ¹ – Multi-Day & True Month Open Levels
This indicator is experimental and designed to help traders visually track opening price levels across multiple days, along with the ICT True Month Open (TMO).
Key Features:
Supports up to 12 configurable multi-day opening sessions, each with independent color, style, width, and label options.
Automatically detects the True Month Open using the ICT method (2nd Monday of each month) and plots it on the chart.
Lines can extend dynamically and are limited to a user-defined number of historical bars for clarity.
Fully customizable timezones, label sizes, and display options.
This indicator is ideal for observing how price interacts with key levels, especially for traders who favor support and resistance-based strategies.
Disclaimer: This is an analytical tool for observation purposes. It does not provide buy or sell signals. Users should combine it with their own analysis and risk management.

Silver BulletSilver Bullet is a trading tool built for finding cleaner, higher-probability setups. It focuses on key windows of market movement and adds helpful tools like daily range levels and candlestick patterns.
Whether you’re trading breakouts or reversals, Silver Bullet gives you a clearer view of the market and more confidence in your setups.
⸻
🔹 Trading Setup #1: Macro Time
The Macro Time setting offers two modes: Macro Bullet and Silver Bullet. Both help traders focus on specific times when the market tends to deliver clean moves.
• Macro Bullet is based on the high and low of a full macro session. It automatically detects the session’s range and bias, then offers optimal entries for either Long or Short setups. Once the session resolves, it provides Fibonacci-based levels for entry, target, and stop loss.
• Silver Bullet is based on ICT concepts and focuses on the hourly range for London, NY AM, and NY PM sessions. It’s designed for quick time blocks and highlights key levels as the session unfolds.
To use this setup, set Macro Time to “ICT Sessions” and select your preferred mode under Bullet Mode.
⸻
🔹 Trading Setup #2: Daily Range
Enable Daily Range to draw Fibonacci levels based on either the previous day’s candle or the current day’s developing range. These levels help you identify potential support, resistance, and midpoint zones throughout the day.
With the current day’s range, levels automatically update in real time as new highs or lows form — keeping your chart aligned with evolving price action.
⸻
🔹 Trading Setup #3: Candlestick Patterns
Turn on Candlestick Patterns to automatically highlight clean reversal signals such as Hammers, Hanging Men, Shooting Stars, and Tweezers. Each pattern is detected using specific criteria and trend filters to reduce noise and improve reliability. They work especially well as confirmation signals around key levels or session zones.
Silver Bullet brings structure, clarity, and precision to your intraday trading. By combining time-based bias, price action levels, and pattern recognition, it helps you trade with purpose — not guesswork. Use one setup or combine all three for a complete view of the market, tailored to your style and session of choice.

OB/OS adaptative v1.1# OB/OS Adaptative v1.1 - Multi-Timeframe Adaptive Overbought/Oversold Indicator
## Overview
The `tradingview_indicator_emas.pine` script is a sophisticated multi-timeframe indicator designed to identify dynamic overbought and oversold levels in financial markets. It combines EMA (Exponential Moving Average) crossovers and Bollinger Bands across monthly, weekly, and daily timeframes to create adaptive support and resistance levels that adjust to changing market conditions.
## Core Functionality
### Multi-Timeframe Analysis
The indicator analyzes three timeframes simultaneously:
- **Monthly (M)**: Long-term trend identification
- **Weekly (W)**: Intermediate-term trend identification
- **Daily (D)**: Short-term volatility measurement
### Technical Indicators Used
- **EMA 9 and EMA 20**: For trend identification and momentum assessment
- **Bollinger Bands (20-period)**: For volatility measurement and extreme level identification
- **Price action**: For confirmation of level validity and signal generation
## Key Features
### Adaptive Level Calculation
The indicator dynamically determines overbought and oversold levels based on market structure and trend bias:
#### Monthly Level Logic
- **Bullish Bias** (when monthly open > EMA20):
- Oversold = lower of EMA9 or EMA20
- Overbought = upper of EMA9 or Bollinger Upper Band
- **Bearish/Neutral Bias** (when monthly open ≤ EMA20):
- Oversold = Bollinger Lower Band
- Overbought = upper of EMA20 or EMA9
#### Weekly Level Logic
- **Bullish Bias** (when weekly open > EMA20):
- Oversold = lower of EMA9 or EMA20
- Overbought = Bollinger Upper Band
- **Bearish/Neutral Bias** (when weekly open ≤ EMA20):
- Oversold = Bollinger Lower Band
- Overbought = upper of EMA20 or EMA9
#### Daily Level Logic
- Simple Bollinger Bands:
- Oversold = Bollinger Lower Band
- Overbought = Bollinger Upper Band
### Final Level Determination
The indicator combines all three timeframes through a weighted averaging process:
1. Calculates initial values as the average of monthly, weekly, and daily levels
2. Ensures mathematical consistency by enforcing overbought_final ≥ oversold_final using min/max functions
3. Calculates a midpoint average level as the center of the range
### Visual Elements
- **Dynamic Lines**: Draws horizontal lines for current and previous period overbought, oversold, and average levels
- **Labels**: Places clear textual labels at the start of each period
- **Color Coding**:
- Red for overbought levels (resistance)
- Green for oversold levels (support)
- Blue for average levels (pivot point)
- **Transparency**: Previous period lines use semi-transparent colors to distinguish between current and historical levels
### Update Mechanism
- **Calculation Day**: User-defined day of the week (default: Monday)
- On the specified calculation day, the indicator:
- Updates all levels based on previous bar's data
- Draws new lines extending forward for a user-defined number of days
- Maintains previous period lines for comparison and trend analysis
- Automatically deletes and recreates lines to ensure clean visualization
### Proximity Detection
- Alerts when price approaches overbought/oversold levels (configurable distance in percentage)
- Helps identify potential reversal zones before actual crossovers occur
- Distance thresholds are user-configurable for both overbought and oversold conditions
### Alert Conditions
The indicator provides four distinct alert types:
1. **Cross below oversold**: Triggered when price crosses below the oversold level
2. **Cross above overbought**: Triggered when price crosses above the overbought level
3. **Near oversold**: Triggered when price approaches the oversold level within the configured distance
4. **Near overbought**: Triggered when price approaches the overbought level within the configured distance
### Debug Mode
When enabled, displays comprehensive debug information including:
- Current values for all levels (oversold, overbought, average)
- Timeframe-specific calculations and raw data points
- System status information (current day, calculation day, etc.)
- Lines existence and timing information
- Organized in multiple labels at different price levels to avoid overlap
## Configuration Parameters
| Parameter | Default Value | Description |
|---------|---------------|-------------|
| Short EMA (9) | 9 | Length for short-term EMA calculation |
| Long EMA (20) | 20 | Length for long-term EMA calculation |
| BB Length | 20 | Period for Bollinger Bands calculation |
| Std Dev | 2.0 | Standard deviation multiplier for Bollinger Bands |
| Distance to overbought (%) | 0.5 | Percentage threshold for "near overbought" alerts |
| Distance to oversold (%) | 0.5 | Percentage threshold for "near oversold" alerts |
| Calculation day | Monday | Day of week when levels are recalculated |
| Lookback days | 7 | Number of days to extend previous period lines backward |
| Forward days | 7 | Number of days to extend current period lines forward |
| Show Debug Labels | false | Toggle for comprehensive debug information display |
## Trading Applications
### Primary Use Cases
1. **Reversal Trading**: Identify potential reversal zones when price approaches overbought/oversold levels
2. **Trend Confirmation**: Use the adaptive nature of levels to confirm trend strength and direction
3. **Position Sizing**: Adjust position size based on distance from key levels
4. **Stop Placement**: Use opposite levels as dynamic stop-loss references
### Strategic Advantages
- **Adaptive Nature**: Levels adjust to changing market volatility and trend structure
- **Multi-Timeframe Confirmation**: Signals are validated across multiple timeframes
- **Visual Clarity**: Clear color-coded lines and labels enhance decision-making
- **Proactive Alerts**: "Near" conditions provide early warnings before crossovers
## Implementation Details
### Data Security
Uses `request.security()` function to fetch data from higher timeframes (monthly, weekly) while maintaining proper bar indexing with ` ` offset for open prices.
### Performance Optimization
- Uses `var` keyword to declare persistent variables that maintain state across bars
- Efficient line and label management with proper deletion before recreation
- Conditional execution of debug code to minimize performance impact
### Error Handling
- Comprehensive NA (not available) checks throughout the code
- Graceful degradation when data is unavailable for higher timeframes
- Mathematical safeguards to prevent invalid level calculations
## Conclusion
The OB/OS Adaptative v1.1 indicator represents a sophisticated approach to identifying market extremes by combining multiple technical analysis concepts. Its adaptive nature makes it particularly useful in trending markets where static levels may be less effective. The multi-timeframe approach provides a comprehensive view of market structure, while the visual elements and alert system enhance its practical utility for active traders.

Long-Leg Doji Breakout StrategyThe Long-Leg Doji Breakout Strategy is a sophisticated technical analysis approach that capitalizes on market psychology and price action patterns.
Core Concept: The strategy identifies Long-Leg Doji candlestick patterns, which represent periods of extreme market indecision where buyers and sellers are in equilibrium. These patterns often precede significant price movements as the market resolves this indecision.
Pattern Recognition: The algorithm uses strict mathematical criteria to identify authentic Long-Leg Doji patterns. It requires the candle body to be extremely small (≤0.1% of the total range) while having long wicks on both sides (at least 2x the body size). An ATR filter ensures the pattern is significant relative to recent volatility.
Trading Logic: Once a Long-Leg Doji is identified, the strategy enters a "waiting mode," monitoring for a breakout above the doji's high (long signal) or below its low (short signal). This confirmation approach reduces false signals by ensuring the market has chosen a direction.
Risk Management: The strategy allocates 10% of equity per trade and uses a simple moving average crossover for exits. Visual indicators help traders understand the pattern identification and trade execution process.
Psychological Foundation: The strategy exploits the natural market cycle where uncertainty (represented by the doji) gives way to conviction (the breakout), creating high-probability trading opportunities.
The strength of this approach lies in its ability to identify moments when market sentiment shifts from confusion to clarity, providing traders with well-defined entry and exit points while maintaining proper risk management protocols.
How It Works
The strategy operates on a simple yet powerful principle: identify periods of market indecision, then trade the subsequent breakout when the market chooses direction.
Step 1: Pattern Detection
The algorithm scans for Long-Leg Doji candles, which have three key characteristics:
Tiny body (open and close prices nearly equal)
Long upper wick (significant rejection of higher prices)
Long lower wick (significant rejection of lower prices)
Step 2: Confirmation Wait
Once a doji is detected, the strategy doesn't immediately trade. Instead, it marks the high and low of that candle and waits for a definitive breakout.
Step 3: Trade Execution
Long Entry: When price closes above the doji's high
Short Entry: When price closes below the doji's low
Step 4: Exit Strategy
Positions are closed when price crosses back through a 20-period moving average, indicating potential trend reversal.
Market Psychology Behind It
A Long-Leg Doji represents a battlefield between bulls and bears that ends in a stalemate. The long wicks show that both sides tried to push price in their favor but failed. This creates a coiled spring effect - when one side finally gains control, the move can be explosive as trapped traders rush to exit and momentum traders jump aboard.
Key Parameters
Doji Body Threshold (0.1%): Ensures the body is truly small relative to the candle's range
Wick Ratio (2.0): Both wicks must be at least twice the body size
ATR Filter: Uses Average True Range to ensure the pattern is significant in current market conditions
Position Size: 10% of equity per trade for balanced risk management
Pros:
High Probability Setups: Doji patterns at key levels often lead to significant moves as they represent genuine shifts in market sentiment.
Clear Rules: Objective criteria for entry and exit eliminate emotional decision-making and provide consistent execution.
Risk Management: Built-in position sizing and exit rules help protect capital during losing trades.
Market Neutral: Works equally well for long and short positions, adapting to market direction rather than fighting it.
Visual Confirmation: The strategy provides clear visual cues, making it easy to understand when patterns are forming and trades are triggered.
Cons:
False Breakouts: In choppy or ranging markets, price may break the doji levels only to quickly reverse, creating whipsaws.
Patience Required: Traders must wait for both pattern formation and breakout confirmation, which can test discipline during active market periods.
Simple Exit Logic: The moving average exit may be too simplistic, potentially cutting profits short during strong trends or holding losers too long during reversals.
Volatility Dependent: The strategy relies on sufficient volatility to create meaningful doji patterns - it may underperform in extremely quiet markets.
Lagging Entries: Waiting for breakout confirmation means missing the very beginning of moves, reducing potential profit margins.
Best Market Conditions
The strategy performs optimally during periods of moderate volatility when markets are making genuine directional decisions rather than just random noise. It works particularly well around key support/resistance levels where the market's indecision is most meaningful.
Optimization Considerations
Consider combining with additional confluence factors like volume analysis, support/resistance levels, or other technical indicators to improve signal quality. The exit strategy could also be enhanced with trailing stops or multiple profit targets to better capture extended moves while protecting gains.
Best for Index option,
Enjoy !!

Market Strength Buy Sell Indicator [TradeDots]A specialized tool designed to assist traders in evaluating market conditions through a multifaceted analysis of relative performance, beta-adjusted returns, momentum, and volume—allowing you to identify optimal points for long or short trades. By integrating multiple benchmarks (default S&P 500) and percentile-based thresholds, the script provides clear, actionable insights suitable for both day trading and higher-level timeframe assessments.
📝 HOW IT WORKS
1. Multi-Factor Composite Score
Relative Performance (RS Ratio): Compares your asset’s performance to a chosen benchmark (default: SPY). Values above 1.0 indicate outperformance, while below 1.0 suggest underperformance.
Beta-Adjusted Returns: Checks the ticker’s excess movement relative to expected market-related moves. This helps distinguish pure “alpha” from broad market effects.
Volume & Correlation: Volume spikes often confirm the momentum behind a move, while correlation measures how closely the asset tracks or diverges from its benchmark.
These components merge into a 0–100 composite score. Scores above 50 frequently imply bullish strength; drops below 50 often point to underperformance—potentially flagging short opportunities.
2. Intraday & Day Trading Focus
Monitoring Below 50: During the trading day, the script calculates live data against the benchmark, offering an intraday-sensitive composite score. A dip under 50 may indicate a short bias for that session, especially when accompanied by high volume or momentum shifts.
3. Higher Timeframe Monitoring
Daily Strategies: On daily or weekly charts, the script reveals overall relative strength or weakness compared to the S&P 500. This higher-level perspective helps form broader trading biases—crucial for swing or position trades spanning multiple days.
Long/Short Thresholds: Persistent readings above 50 on a daily chart typically reinforce a long bias, while consistent dips below 50 can sustain a short or cautious outlook.
4. Pair Trading Applications
Custom Benchmark Selection: By setting a specific ticker pair as your benchmark instead of the default S&P 500, you can identify spread trading opportunities between two correlated assets. This allows you to go long the outperforming asset while shorting the underperforming one when the spread reaches extreme levels.
4. Color-Coded Signals & Alerts
Visual Zones (25–75): Color-coded bands highlight strong outperformance (above 75) or pronounced underperformance (below 25).
Alerts on Strong Shifts: Automatic alerts can notify you of sudden entries or exits from bullish or bearish zones, so you can potentially act on new market information without delay.
⚙️ HOW TO USE
1. Select Your Timeframe: For scalping or day trading, lower intervals (e.g., 5-minute) offer immediate data resets at the session’s start. For multi-day insight, daily or weekly charts reveal broader performance trends.
2. Watch Key Levels Around 50: Intraday dips under 50 may be a cue to consider short trades, while bounces above 50 can confirm renewed strength.
3. Assess Benchmark Relationships: Compare your asset’s score and signals to the broader market. A stock falling below its pair’s relative strength line might lag overall market momentum.
4. Combine Tools & Validate: This script excels when integrated with other technical analysis methods (e.g., support/resistance, chart patterns) and fundamental factors for a holistic market view.
❗ LIMITATIONS
No Direction Guarantee: The indicator identifies relative strength but does not guarantee directional price moves.
Delayed Updates: Since calculations update after each bar close, sudden intrabar changes may not immediately reflect.
Market-Specific Behaviors: Some assets or unusual market conditions may deviate from typical benchmarks, weakening signal reliability.
Past ≠ Future: High or low relative strength in the past may not predict continued performance.
RISK DISCLAIMER
All forms of trading and investing involve risk, including the possible loss of principal. This indicator analyzes relative performance but cannot assure profits or eliminate losses. Past performance of any strategy does not guarantee future results. Always combine analysis with proper risk management and your broader trading plan. Consult a licensed financial advisor if you are unsure of your individual risk tolerance or investment objectives.

Oculus Ultra Parallel S/R Channel**Oculus Ultra Parallel S/R Channel**
*Version 1.0 | Pine Script v6*
**Overview**
This indicator overlays a statistically-driven support/resistance channel on your chart by fitting a linear regression (median) line and plotting parallel bands at a configurable multiple of standard deviation. It adapts dynamically to both trend and volatility, highlights potential reaction zones, and offers optional alerts when price touches key levels.
**Key Features**
* **Median Regression Line**
Fits a best-fit line through the chosen lookback of price data, showing the underlying trend.
* **Volatility-Based Bands**
Upper and lower bands offset by *N*× standard deviation of regression residuals, capturing dynamic S/R zones.
* **Dynamic Coloring**
* Median line turns **teal** when sloping up, **orange** when sloping down.
* Bands tinted green or red depending on their position relative to the median.
* **Channel Fill**
Optional shaded area between the bands for immediate visual context.
* **Touch Alerts**
Precision alerts and on-chart markers when price touches the support or resistance band, with configurable tick tolerance.
* **Clean Layout**
Minimal lines and plots to avoid chart clutter, adjustable via toggle inputs.
**How to Use**
1. **Apply the Script** – Add to any timeframe in overlay mode.
2. **Configure Inputs** –
* **Channel Length**: Number of bars for regression and volatility calculation.
* **Deviation Factor**: Multiplier for band width (in standard deviations).
* **Show/Hide Elements**: Toggle median line, bands, fill, and touch alerts.
* **Color by Slope**: Enable slope-based median coloring.
* **Touch Tolerance**: Number of ticks within which a band touch is registered.
3. **Interpret the Channel** –
* **Trend**: Follow the slope and color of the median line.
* **Support/Resistance**: Bands represent dynamic zones where price often reacts.
* **Alerts**: Use touch markers or alert pop-ups to time entries or exits at band levels.
**Inputs**
* **Channel Length** (default: 100)
* **Deviation Factor** (default: 1.0)
* **Show Median Regression Line** (true/false)
* **Show Channel Bands** (true/false)
* **Fill Between Bands** (true/false)
* **Color Median by Slope** (true/false)
* **Alert on Band Touch** (true/false)
* **Touch Tolerance (ticks)** (default: 2)
**Version History**
* **1.0** – Initial release with dynamic regression channel, slope coloring, band fill, and touch alerts.
**Disclaimer**
This indicator is intended for educational purposes. Always backtest with your own settings and apply sound risk management before trading live.

Bollinger Bands Z-ScoreBollinger Bands Z-Score Indicator
This indicator transforms the classic Bollinger Bands into a Z-Score oscillator displayed in a separate pane. It standardizes the Bollinger Bands’ basis line by calculating the Z-Score over a user-defined period, allowing you to see how many standard deviations the price deviates from the mean.
Upper and Lower Fixed Lines: These are set at +2 and -2 Z-Score levels, representing common thresholds for overbought and oversold conditions.
Z-Score Oscillator: The normalized Bollinger Bands oscillate smoothly between these fixed boundaries, providing a clearer perspective on volatility extremes.
Z-Score Table: Displayed on the right side, this table shows the current Z-Score value, along with fixed maximum (+2) and minimum (-2) limits, making it easy to track current momentum and volatility in real-time.
Use Cases:
Identify overextended price moves with standardized volatility measures.
Spot potential reversals or continuation setups by observing the Z-Score crossing key levels.
Complement traditional Bollinger Bands analysis with a statistically normalized perspective.
Input Parameters:
Length: The period used for Bollinger Bands and Z-Score calculation.
MA Type: Choose the moving average type for the basis line (SMA, EMA, SMMA, WMA, VWMA).
StdDev: Multiplier for the standard deviation bands.
Z-Score Length: The lookback period used to compute the mean and standard deviation for Z-Score normalization.
This indicator is perfect for traders seeking a statistically sound and visually clear representation of Bollinger Bands volatility and extremes.

Order Block Matrix [Alpha Extract]The Order Block Matrix indicator identifies and visualizes key supply and demand zones on your chart, helping traders recognize potential reversal points and high-probability trading setups.
This tool helps traders:
Visualize key order blocks with volume profile histograms showing liquidity distribution.
Identify high-volume price levels where institutional activity occurs.
rank historical order blocks and analyze their strength based on volume.
Receive alerts for potential trading opportunities based on price-block interactions.
🔶 CALCULATION
The indicator processes chart data to identify and analyze order blocks:
Order Block Detection
Inputs:
Price action patterns (consolidation areas followed by breakouts).
Volume data from current and lower timeframes.
User-defined lookback periods and thresholds.
Detection Logic:
Identifies consolidation areas using a dynamic range comparison.
Confirms breakout patterns with percentage threshold validation.
Maps volume distribution across price levels within each order block.
🔶Volume Analysis
Volume Profiling:
Divides each order block into configurable grid segments.
Maps volume distribution across price segments within blocks.
Highlights zones with highest volume concentration.
Strength Assessment:
Calculates total block volume and relative strength metrics.
Compares block volume to historical averages.
Determines probability of reversal based on volume patterns.
isConsolidation(len) =>
high_range = ta.highest(high, len) - ta.lowest(high, len)
low_range = ta.highest(low, len) - ta.lowest(low, len)
avg_range = (high_range + low_range) / 2
current_range = high - low
current_range <= avg_range * (1 + obThreshold)
🔶 DETAILS
Visual Features
Volume Profile Histograms:
Color-coded bars showing volume concentration within order blocks.
Gradient coloring based on relative volume (high volume = brighter colors).
Bull blocks (green/teal) and bear blocks (red) with varying opacity.
Block Visualization:
Dynamic box sizing based on volume concentration.
Optional block borders and background fills.
Volume labels showing total block volume.
Screener Table:
Real-time analysis of order block metrics.
Shows block direction, proximity, retest count, and volume metrics.
Color-coded for quick reference.
Interpretation
High Volume Areas: Zones with institutional interest and potential reversal points.
Block Direction: Bullish blocks typically support price, bearish blocks typically resist price.
Retests: Multiple tests of an order block may strengthen or weaken its influence.
Block Age: Newer blocks often have stronger influence than older ones.
Volume Concentration: Brightest segments within blocks represent the highest volume areas.
🔶 EXAMPLES
The indicator helps identify key trading opportunities:
Bullish Order Blocks
Support Zones: Identify strong support levels where price is likely to bounce.
Breakout Confirmation: Validate breakouts with volume analysis to avoid false moves.
Retest Strategies: Enter trades when price retests a bullish order block with high volume.
Bearish Order Blocks
Resistance Zones: Identify strong resistance levels where price is likely to reverse.
Distribution Areas: Detect zones where smart money is distributing to retail.
Short Opportunities: Find optimal short entry points at high-volume bearish blocks.
Combined Strategies
Order Block Stacking: Multiple aligned blocks create stronger support/resistance zones.
Block Mitigation: When price breaks through a block, it often indicates a strong trend continuation.
Volume Profile Applications: Higher volume segments provide more precise entry and exit points.
🔶 SETTINGS
Customization Options
Order Block Detection:
Consolidation Lookback: Adjust the period for consolidation detection.
Breakout Threshold: Set minimum percentage for breakout confirmation.
Historical Lookback Limit: Control how far back to scan for historical order blocks.
Maximum Order Blocks: Limit the number of visible blocks on the chart.
Visual Style:
Grid Segments: Adjust the number of volume profile segments.
Extend Blocks to Right: Enable/disable extending blocks to current price.
Show Block Borders: Toggle border visibility.
Border Width: Adjust thickness of block borders.
Show Volume Text: Enable/disable volume labels.
Volume Text Position: Control placement of volume labels.
Color Settings:
Bullish High/Low Volume Colors: Customize appearance of bullish blocks.
Bearish High/Low Volume Colors: Customize appearance of bearish blocks.
Border Color: Set color for block outlines.
Background Fill: Adjust color and transparency of block backgrounds.
Volume Text Color: Customize label appearance.
Screener Table:
Show Screener Table: Toggle table visibility.
Table Position: Select positioning on the chart.
Table Size: Adjust display size.
The Order Block Matrix indicator provides traders with powerful insights into market structure, helping to identify key levels where smart money is active and where high-probability trading opportunities may exist.

Smart Dynamic Levels [ATR-Based]Smart Dynamic Levels
Automated Support & Resistance Levels Based on Market Volatility
Overview:
This advanced indicator automatically plots dynamic support and resistance levels based on the Average True Range (ATR), creating meaningful price zones that adapt to changing market conditions. Unlike static round-number levels, these volatility-adjusted zones provide more relevant technical reference points.
Key Features:
Volatility-Responsive: Levels automatically adjust based on the asset's ATR
Smart Visualization:
Color gradient shows strength of each level (darker = stronger)
Bullish (green) levels below price, bearish (red) levels above
Customizable Settings:
Adjust ATR length (14-period default)
Modify level sensitivity with ATR multiplier (1.5x default)
Choose number of levels to display (5 above/below default)
Toggle labels and line extensions
How It Works:
Calculates the asset's true volatility using ATR
Rounds to significant price intervals based on current volatility
Plots equidistant levels above and below current price
Colors levels based on their position relative to price
Automatically updates as market conditions change
Recommended Use:
Day Trading: Identify intraday support/resistance zones
Swing Trading: Spot potential reversal areas
Breakout Trading: Watch for moves beyond key levels
Works on all markets: Stocks, Forex, Crypto, Futures
Settings Guide:
ATR Length: Higher values for smoother levels (14-20)
Multiplier: Increase for wider levels (1.5-3x)
Levels Count: More levels for higher timeframes (3-10)
Pro Tips:
Combine with trend analysis - levels are more significant when aligned with trend
Watch for price reactions at these levels for confirmation
Use wider levels (higher multiplier) for volatile assets

Dual Volume Divergence LineDual Volume Divergence Line (DVD/Line)
🔹 Overview
The Dual Volume Divergence Line (DVD/Line) is a custom Pine Script™ indicator designed to identify potential trend reversals and continuations by analyzing volume and price divergences. This script is inspired by the original concept of the Dual Volume Divergence Index (DVDI) by DonovanWall and has been modified and enhanced by keremertem. Special thanks to DonovanWall for the original concept. The indicator combines volume-based calculations with price action to generate signals for bullish and bearish divergences, both normal and hidden. Below is a detailed breakdown of its components and functionality.
🔹 Key Features of the DVD/Line Indicator
1. Dual Volume Divergence Calculation:
- The indicator calculates two primary volume-based indices: the Positive Volume Index (PVI) and the Negative Volume Index (NVI).
- PVI measures the impact of volume on price when the price increases, while NVI measures the impact when the price decreases.
- These indices are used to detect divergences between volume and price, which can signal potential reversals or continuations.
2. Customizable Inputs:
- DVD Sampling Period: Adjusts the sensitivity of the indicator by controlling the lookback period for calculating the volume-weighted moving averages (VWMA) of PVI and NVI.
- Band Width: Defines the range for calculating the upper and lower bands, which act as dynamic support and resistance levels.
- Source: Allows users to select the price source (e.g., `hlc3`, `close`, etc.) for calculations.
3. Volume-Weighted Moving Averages (VWMA):
- Instead of using traditional moving averages, the script employs VWMA to smooth the PVI and NVI signals. This ensures that the indicator is more responsive to changes in volume.
4. Upper and Lower Bands:
- The upper and lower bands are calculated using the Root Mean Square (RMS) of the highest and lowest values of the DVD line over a user-defined period. These bands help identify overbought and oversold conditions.
5. Divergence Detection:
- The script identifies four types of divergences:
- Normal Bullish Divergence: Occurs when price makes a lower low, but the DVD line makes a higher low.
- Hidden Bullish Divergence: Occurs when price makes a higher low, but the DVD line makes a lower low.
- Normal Bearish Divergence: Occurs when price makes a higher high, but the DVD line makes a lower high.
- Hidden Bearish Divergence: Occurs when price makes a lower high, but the DVD line makes a higher high.
- These divergences are visually highlighted on the chart using labels.
6. Customizable Divergence Selection:
- Users can choose between two types of divergence calculations:
- DVDI: Based on the raw divergence values.
- DVD Line: Based on the smoothed DVD line.
7. Visual Enhancements:
- The DVD line is plotted with a color-coded scheme: blue when the DVD line is above its signal line (bullish) and pink when it is below (bearish).
- The upper and lower bands are displayed as step lines, making it easier to identify key levels.
🔹 How the Indicator Works
1. Volume-Based Calculations:
- The script starts by calculating the PVI and NVI based on the selected price source and volume data.
- PVI increases when the price rises, while NVI decreases when the price falls. These indices are then smoothed using VWMA to generate signals.
2. DVD Line Calculation:
- The DVD line is derived by combining the divergences of PVI and NVI. It is further smoothed using a Weighted Moving Average (WMA) and a linear regression line for trend analysis.
3. Divergence Detection:
- The script identifies pivot points in the DVD line and compares them with price action to detect divergences.
- Normal divergences indicate potential reversals, while hidden divergences suggest trend continuations.
4. Dynamic Bands:
- The upper and lower bands are calculated using RMS, which provides a more accurate representation of volatility compared to standard deviation or fixed-width bands.
5. Labeling:
- Divergences are labeled directly on the chart with clear text and color coding:
🟢 Bullish Divergence: Green label with "Bull".
🟩 Bearish Divergence: Red label with "Bear".
🔴 Hidden Bullish Divergence: Lime label with "hid.".
🟧 Hidden Bearish Divergence: Orange label with "hid.".
🔹 Unique Aspects of This Script
1. Volume-Weighted Smoothing:
- Unlike traditional divergence indicators that rely on simple moving averages, this script uses VWMA and WMA to ensure that volume plays a significant role in signal generation.
2. Dynamic Bands with RMS:
- The use of RMS for calculating bands provides a more adaptive and accurate representation of market conditions, especially in volatile markets.
3. Flexible Divergence Selection:
- Users can choose between raw divergence values (DVDI) or smoothed values (DVD Line), allowing for greater customization based on trading style.
4. Comprehensive Divergence Detection:
- The script detects both normal and hidden divergences, providing a complete picture of potential trend reversals and continuations.
5. User-Friendly Visuals:
- The color-coded DVD line and cross-style bands make it easy to interpret the indicator at a glance.
🔹 How to Use the Indicator
1. Trend Identification:
- Use the Middle Band and its color to identify the current trend. A green line suggests bullish momentum, while a red line indicates bearish momentum. Additionally, a bullish momentum may be indicated when the DVD line crosses up, and a bearish momentum may be indicated when it crosses down the Middle Band.
2. Divergence Trading:
- Look for divergences between the DVD line and price action. Normal divergences can be used for counter-trend trades, while hidden divergences can confirm trend continuations.
3. Band Breakouts:
- Monitor the upper and lower bands for potential breakout or reversal signals. A break above the upper band may indicate overbought conditions, while a break below the lower band may suggest oversold conditions.
4. Customization:
- Adjust the sampling period and band width to suit different timeframes and trading strategies. Shorter periods are more sensitive, while longer periods provide smoother signals.
🔹 Conclusion
The Dual Volume Divergence Line (DVD/Line) is a powerful and versatile indicator that combines volume analysis with price action to generate actionable trading signals. Its unique use of volume-weighted smoothing, dynamic bands, and comprehensive divergence detection sets it apart from traditional divergence indicators. Whether you're a day trader or a long-term investor, this tool can help you identify high-probability trading opportunities with greater accuracy and confidence.
📌 Disclaimer: This script is for educational purposes only and does not constitute financial advice. Always conduct your own analysis before making trading decisions.
